Air Pollution AI Dashboard Template

About
A reusable dark-mode AI dashboard template for air pollution analysis with maps, ML insights, and SHAP explainability for environmental and research projects.
PollutionNet Air Pollution AI Dashboard Template delivers a polished landing + app experience for environmental analytics.
What’s Included
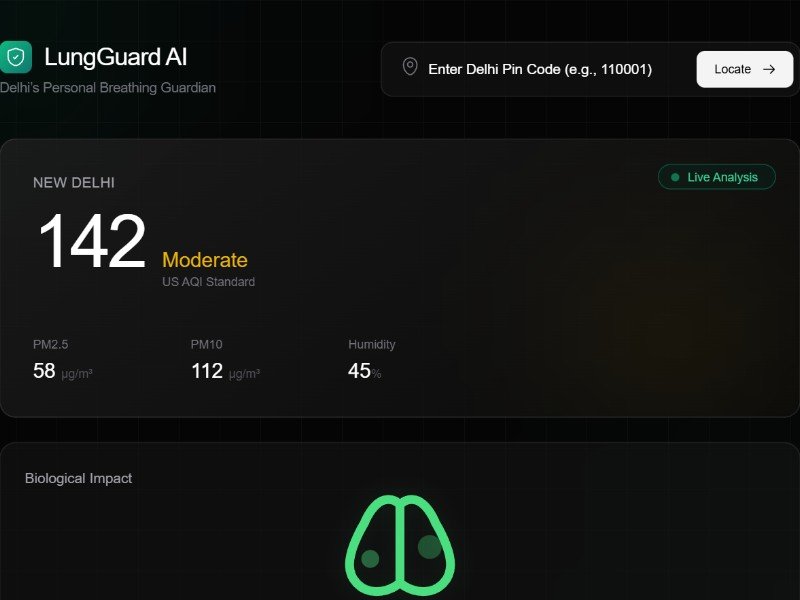
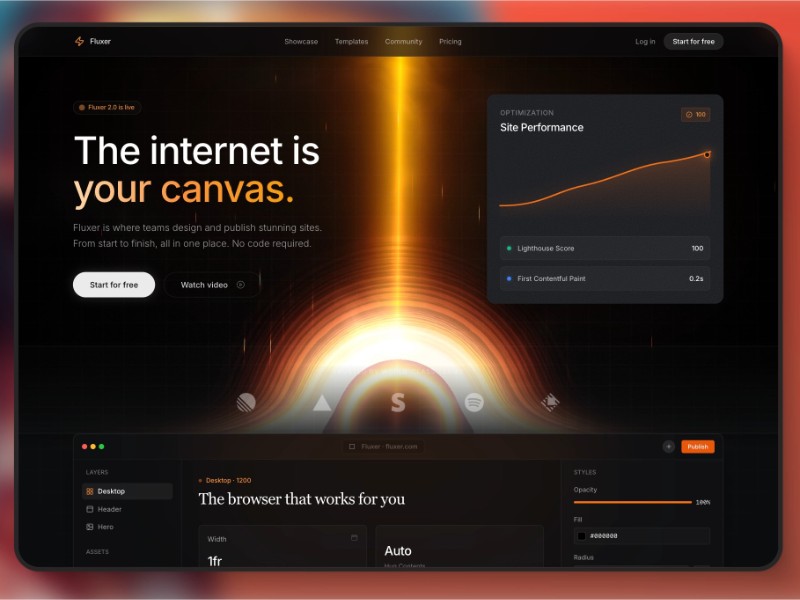
- Hero landing section with gradient headline, key metrics, and "Start Analysis" CTA
- Multi-tab AI dashboard for overview, geo-spatial map, prediction, EDA, and model comparison
- Interactive charts using Chart.js for forecasts, SHAP impact, and distributions
- Leaflet map with pollution risk markers and legend
- AI assistant widget and export-report interaction for realistic workflows
Key Features
- Dark, glassmorphism interface optimized for analytics
- ML-focused copy (ensemble models, SHAP, Prophet, metrics table)
- Ready-made layout for research or city AQI monitoring
- Responsive Tailwind CSS structure with 3D Three.js hero globe
Primary Use Case: Quickly spin up an environmental or AI research dashboard UI for air quality, risk prediction, and data storytelling projects.
Created
February 2, 2026
Category
Web
Remixes
0
FAQs
Creator
Joined about 6 hours ago
2 designs
0 profile views